Configuring a CloudWatch Dashboard give us views of the health and performance of all AWS resources.
I will provide steps by steps of creating an EC2 instance for Windows and then configuring a CloudWatch Dashboard to get aggregated views of the health and performance information for that instance.
Background
Amazon CloudWatch is a monitoring and observability service provided by Amazon Web Services (AWS). It allows you to collect and track metrics, collect and monitor log files, and set alarms to trigger automated actions based on predefined thresholds.
CloudWatch provides a wide range of metrics for various AWS services. These metrics help you understand the behavior and performance of your resources.
Prerequisite
For this project, you need:
- an AWS account. Set up a Free-Tier account www.aws.amazon.com/free
- an IAM user or role in your AWS account.
Project Outline
Using CloudWatch dashboard, monitor a Windows EC2 machine to identify CPU and memory bottlenecks .
Let’s have fun!
Step 1: Deploy the infrastructure
- Deploy VPC using this CloudFormation template here: vpc-alb-app-db.yaml
- Sign in to the AWS Management Console, select your preferred region, and go to the CloudFormation console.
- Click Create Stack.
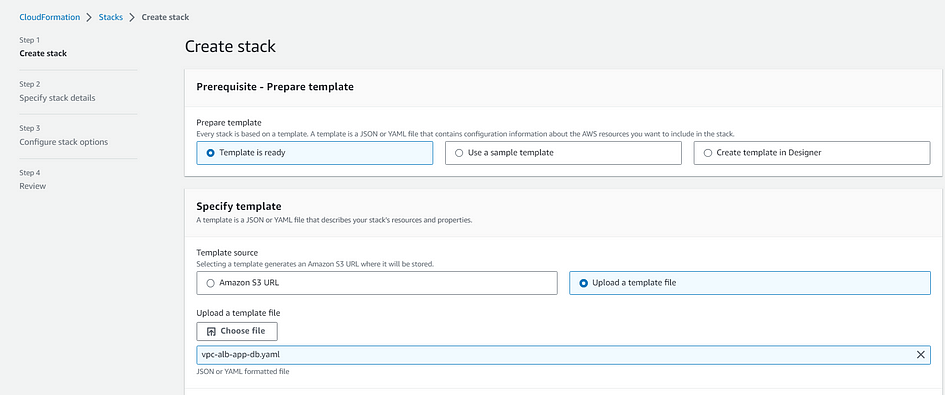
- Click on Template is ready. Click on Upload a template file and then click Choose file.
- Choose the CloudFormation template you downloaded above, return to the CloudFormation console page and click Next.
- Enter the following details:
= > Stack name: The name of this stack. For this lab, use PerfLab-VPC and match the case.
= > Parameters: Parameters may be left as defaults, you can find out more in the description for each.
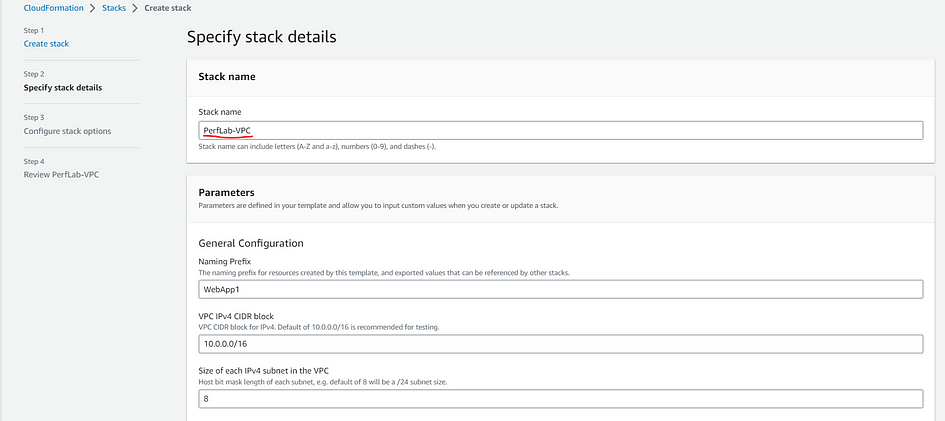
- At the bottom of the page click Next.
- Click on tags. Enter Owner in the left column which is the key, and your email address in the right column which is the value. We will not use additional permissions or advanced options so click Next.
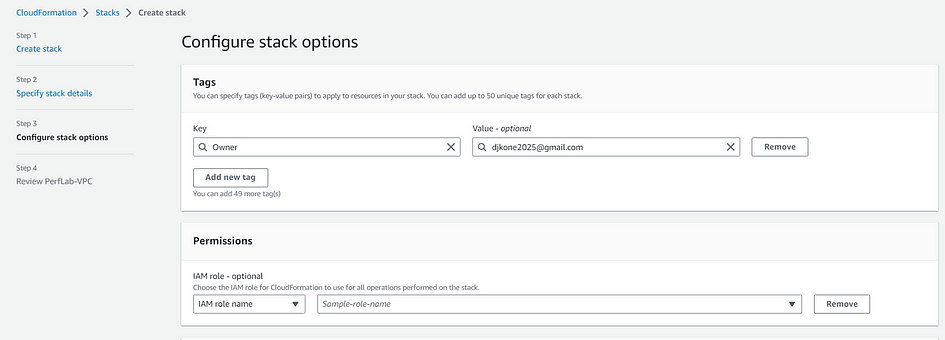
- At the bottom of the page check I acknowledge that AWS CloudFormation might create IAM resources with custom names then click Submit to create the stack.

- Wait a few minutes for the final stack status. You have now created the VPC stack.
Step 2: Deploy the EC2 instance
- Download the WindowsMachineDeploy.yaml CloudFormation template to your machine.
- Go back to the CloudFormation Console, select your preferred region, and click Create Stack > With new resources
- Click Create Stack.
- Select Upload a template file For Template source
- Click Choose file and supply the CloudFormation template you downloaded: WindowsMachineDeploy.yaml
- Click Next
- For Stack name use WindowsMachineDeploy. For Parameters, leave their default values.
- Click Next.
- For tags, enter Owner in the left column which is the key, and your email address in the right column which is the value. Then, click Next.
- At the bottom of the page, select I acknowledge that AWS CloudFormation might create IAM resources with custom names
- Click Create stack.
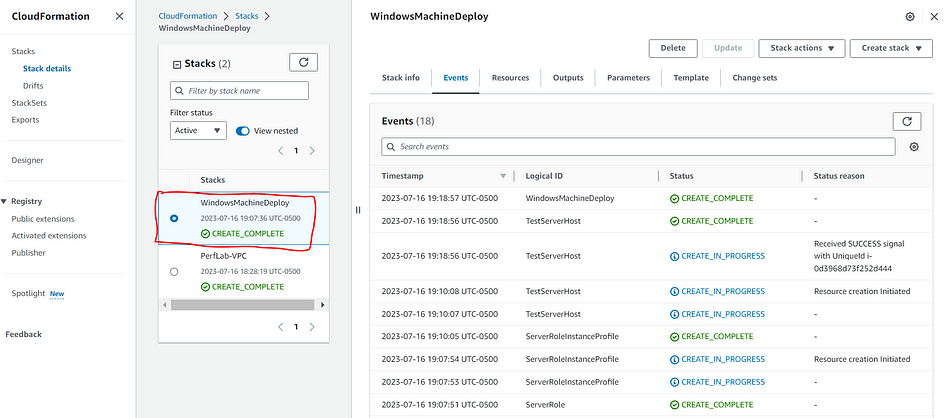
- This will take you to the CloudFormation stack status page, showing the stack creation in progress.
- When it shows status CREATE_COMPLETE, then you are finished with this step. You have deployed a single Windows 2 EC2 instance.
Step 3: Create CloudWatch Dashboard
In this step, I will create a CloudWatch Dashboard to monitor the memory and CPU resources consumed by the instance.
- From the AWS Console, click the search box and type in CloudWatch.
- Click on Dashboards on the left side

- Click on Create Dashboard.
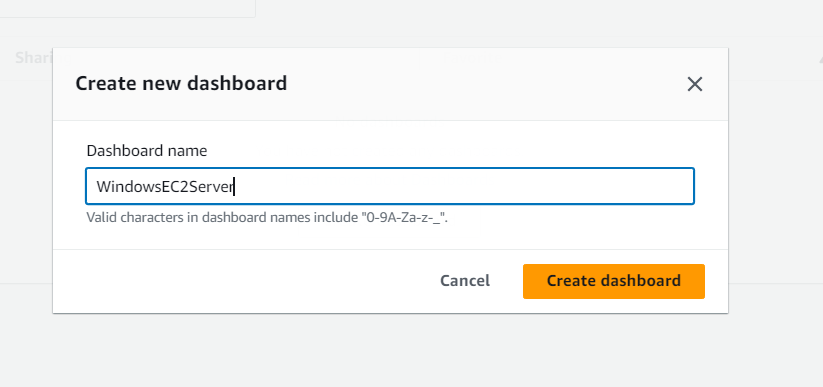
- In the dialog box, type in “WindowsEC2Server” under Dashboard Name, and then click “Create Dashboard”.
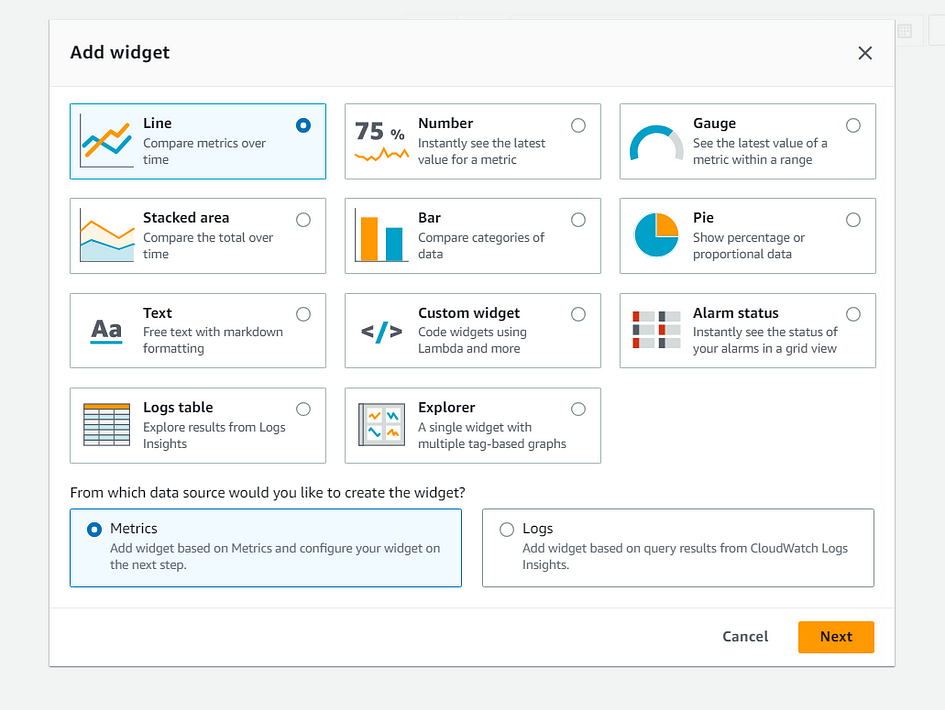
- You will see another dialog box. Select Line, then Metrics and click Next.
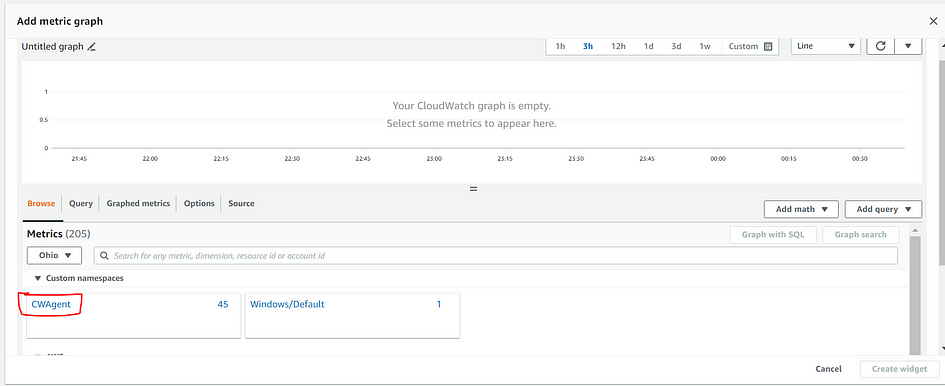
- Under “Metrics”, go to “Custom Namespaces” and click on “CWAgent”
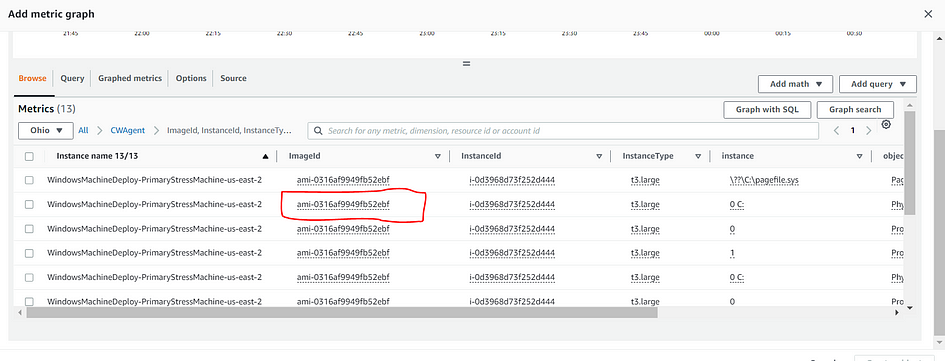
- You will find multiple metrics, but we will start with each of the CPU’s in the machine.
- Click on “ImageId, InstanceId, InstanceType, instance, o…”

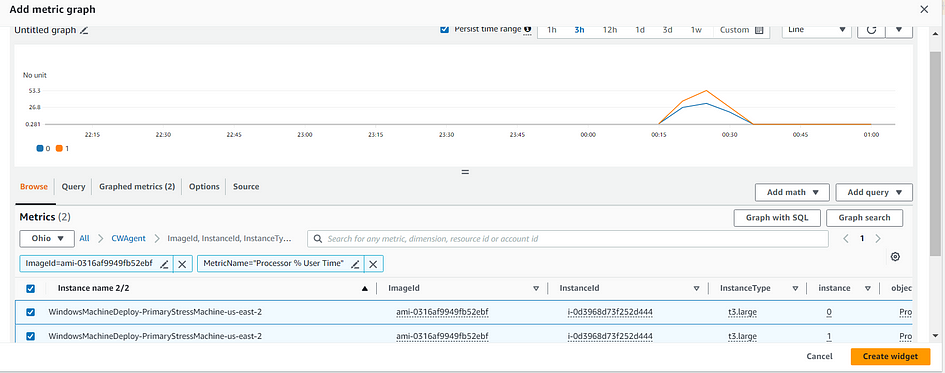
- All Instance Name starts with WindowsMachineDeploy. Click on one of the InstanceId and select “Search for this only”.

- Under Metric Name, look for “Processor % User Time” and then click “Add to search”.
Cheat Sheet: This will limit your choices again to only the CPU metrics for this machine. In this case you should see 2 processors listed, but if the machine you have deployed has more, you will see them each listed.

- On the left side of the screen, select the box right above the list, this will add both metrics to your graph.
- Click on the “Graphed Metrics (2)” tab, and on the right side next to Period, select “5 seconds”
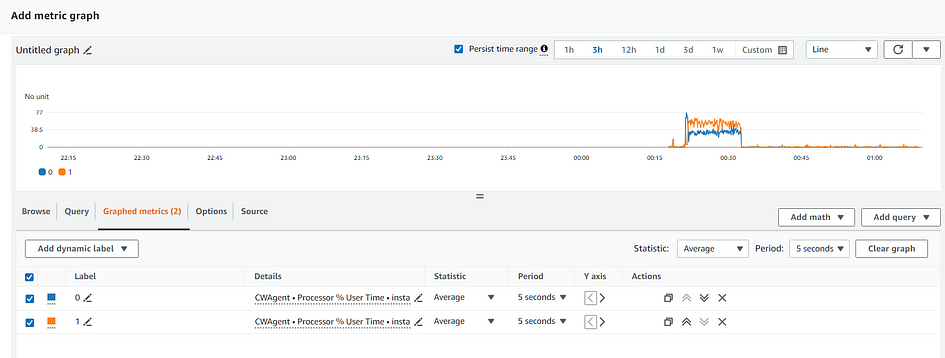
- The metric graph will now update with more data points. Click “Create Widget”
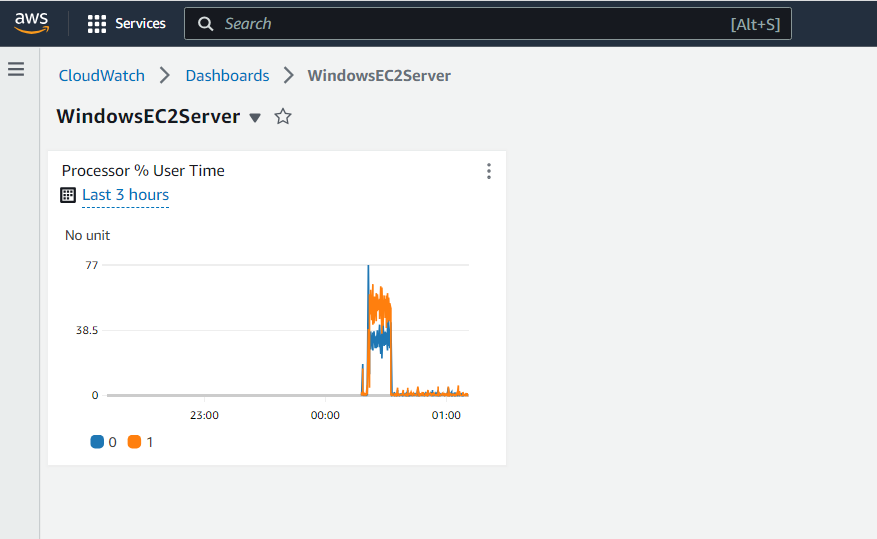
- You should now see the dashboard we have created displayed with the first metric widget.
Step 4: Add metrics to dashboard
- Click on the + button in the upper right corner to add a new widget to our CloudWatch Dashboard.
- In the dialog box, Click Line. Then click Metrics and Next.
- Select CWAgent and then select the second metric group “ImageId, InstanceId, InstanceType, objectname”.
- Search only for the InstanceId if you have multiple machines reporting metrics. Find the “Memory available Mbytes” and click the check box next to it.
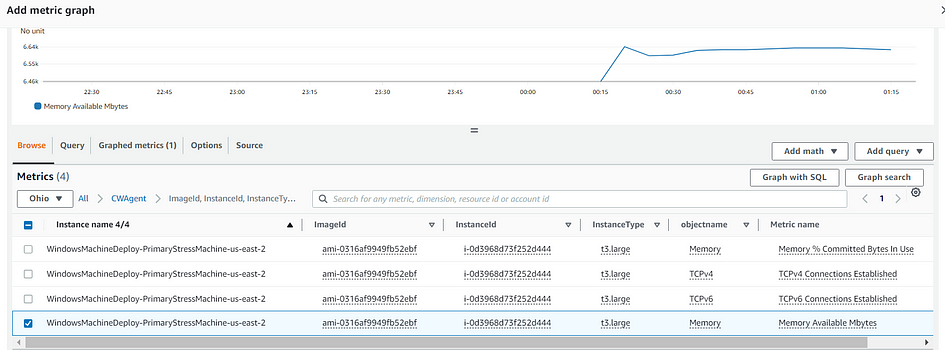
- Click on “Graphed Metrics (1)” and then select “5 seconds” as the period
- Click on Create widget.

- You should now see two widgets on your Dashboard.

Cheat Sheet: You can drag the widgets around the screen and re-size them if you wish. You can also change the time period, select 1h to show just the most recent metrics. It’s also possible to set the auto-refresh rate for the Dashboard by using the pull-down and select 10s.
- Click on “Save Dashboard” before proceeding to the next step.
Step 5: Generate the CPU and Memory loads.
I have a CloudWatch dashboard to show me CPU and Memory statistics for the deployed EC2 instance. Now, lets add a synthetic load to the machine.
I have 2 PowerShell scripts that have already been deployed to the instance to facilitate this.
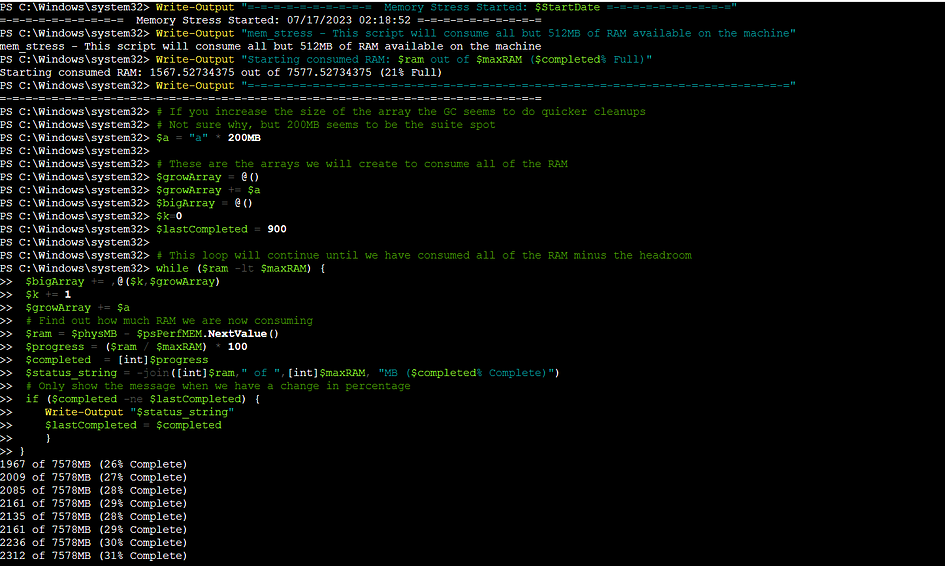
cpu_stress.ps1 will start multiple threads (one per CPU in the machine) to keep the processor busy doing a simple math computation. I set the thread priority to “Lowest” so it should still allow system processes to continue.
mem_stress.ps1 will create an ever expanding array in RAM to attempt to consume as much as possible. I do reserve 512Mb of ram for the OS to continue to operate.
- Open a new tab for the AWS console with this link.
- You should see the EC2 instance we have deployed.

- Click the checkbox next to the machine, and then click “Connect”.
- Select “Session Manager” and then click Connect. This will open a new tab with a PowerShell console for the instance.
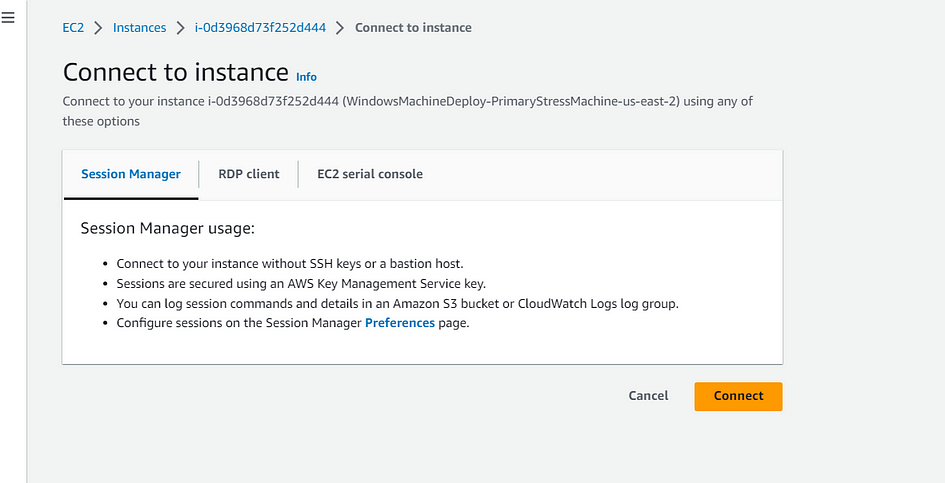
- Copy the mem_stress.ps1 code here and paste it in the powershell. It will start to consume memory resources
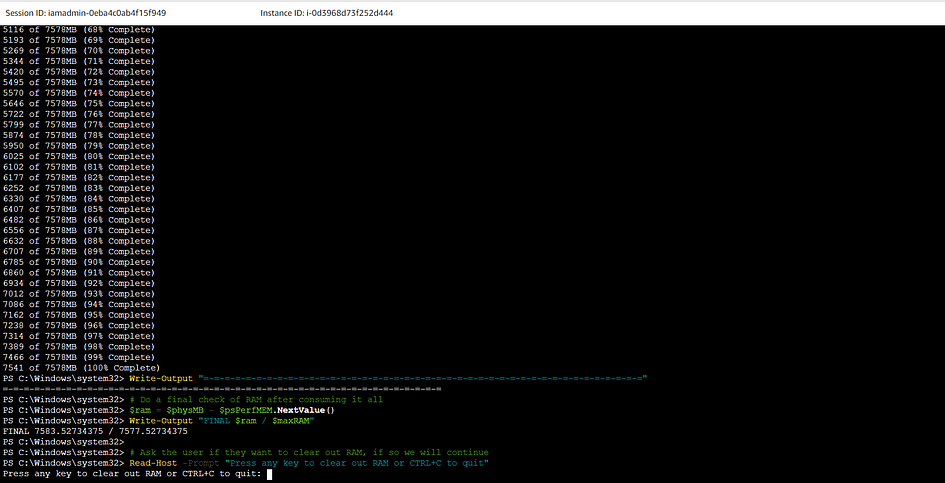
- Go back to the previous broswer tab that has the EC2 console connect screen and click Connect again. This will open another PowerShell console.

- Copy the cpu_stress.ps1 code here and paste it in the console powershell and it will start to consume CPU resources

- Go back to your browser tab that contains the CloudWatch Dashboard. You should see the CPU and Memory graphs change within 10–15 seconds. Processor % User Time goes up as the test script consumes CPU. Memory Available goes down, as the script consumes all of it except for a small reserve.
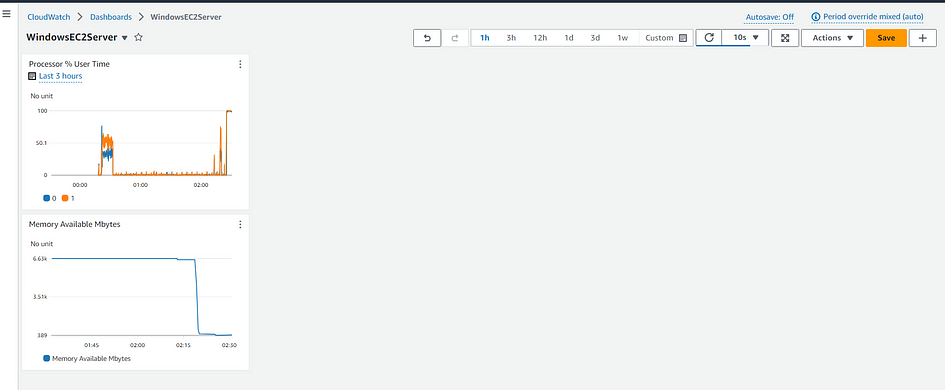
- As time goes on, it will continue to update the graph. In order to remove the load, go back to each of the console windows and simply press any key. This will cause the script to reclaim all resources it has consumed.
- Go back to your browser tab that contains the CloudWatch Dashboard to watch as the CPU load goes down and the amount of free RAM increases.
Voilà! You know how to have an EC2 instance report its metrics to CloudWatch.
It’s also possible to define the Key Performance Indicators (KPIs) to measure workload performance. (Go further by creating an Ec2 Cloudwatch alarm and following these steps).
Thank you for reading and/or following along!


Leave a Reply